Overview
This documentation guides you in navigating the Analytics section of Globber website.
Analytics provide reports on various aspects of e-commerce performance, including detailed insights into products, revenue, orders, and even stock statuses.
How to View Analytics
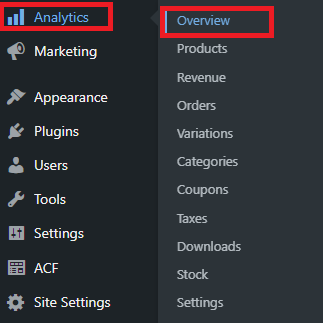
In WordPress dashboard, navigate to the Analytics tab on the left-hand side menu and select Overview
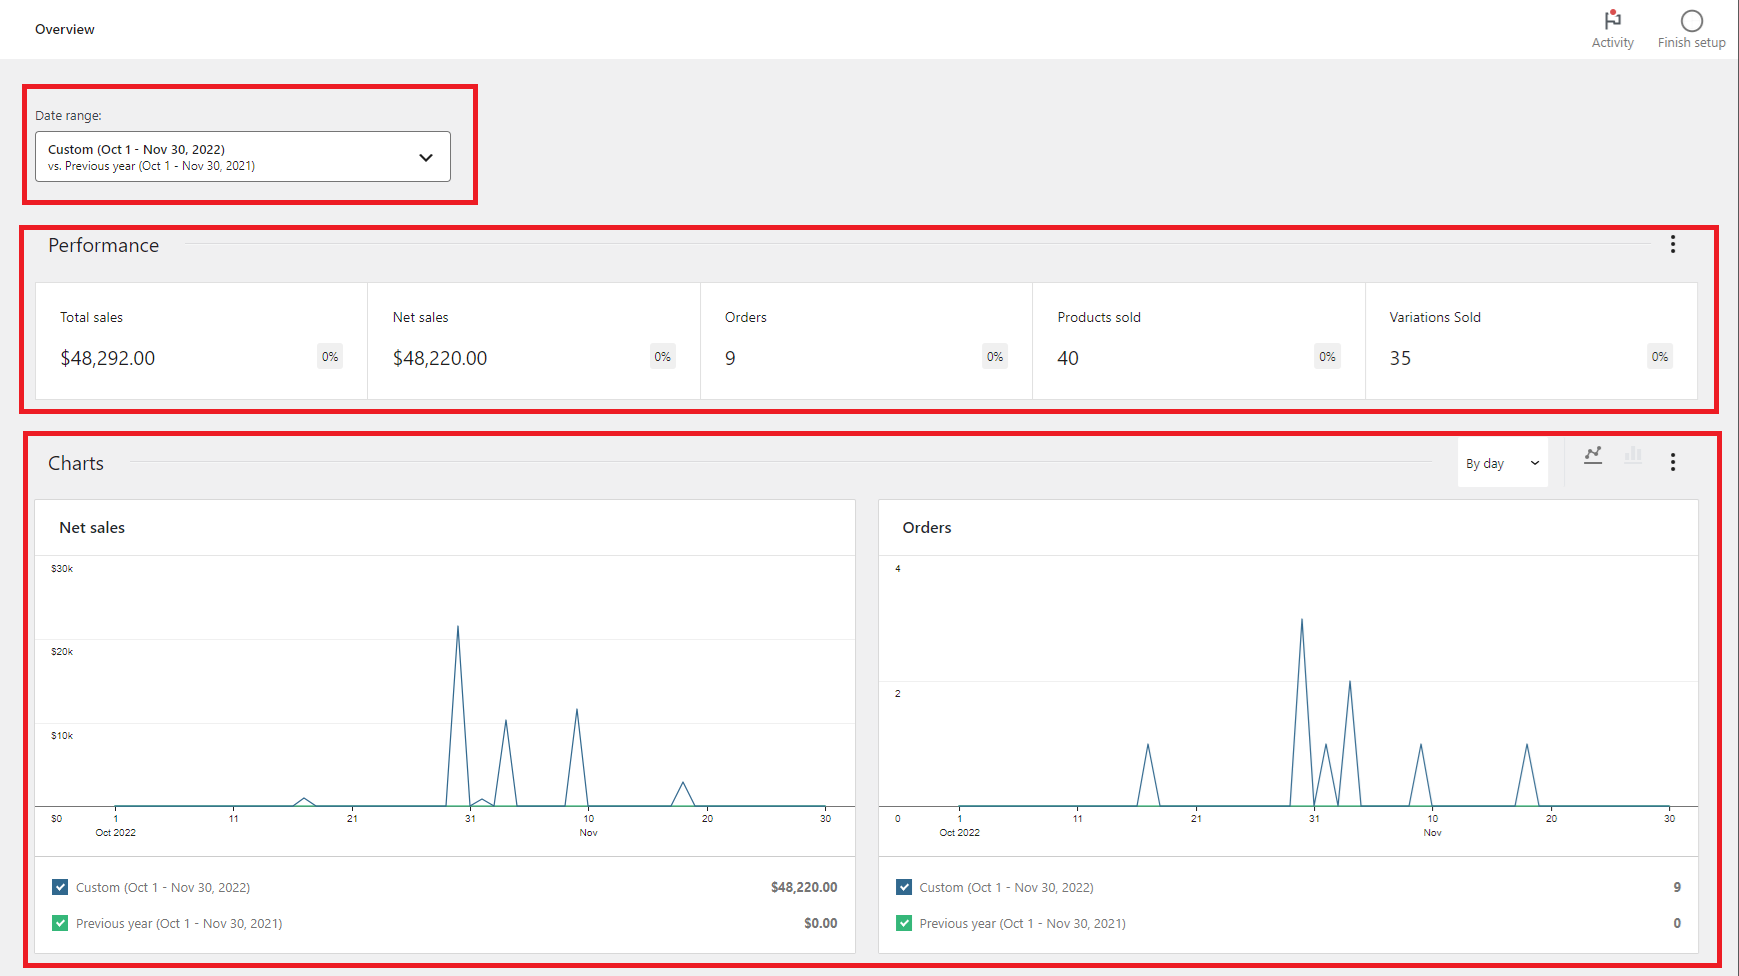
The overview section provides a quick snapshot of performance, showing total sales, order counts, charts, and other key metrics. You can choose specific date ranges, including daily, weekly, monthly, or a custom timeframe.
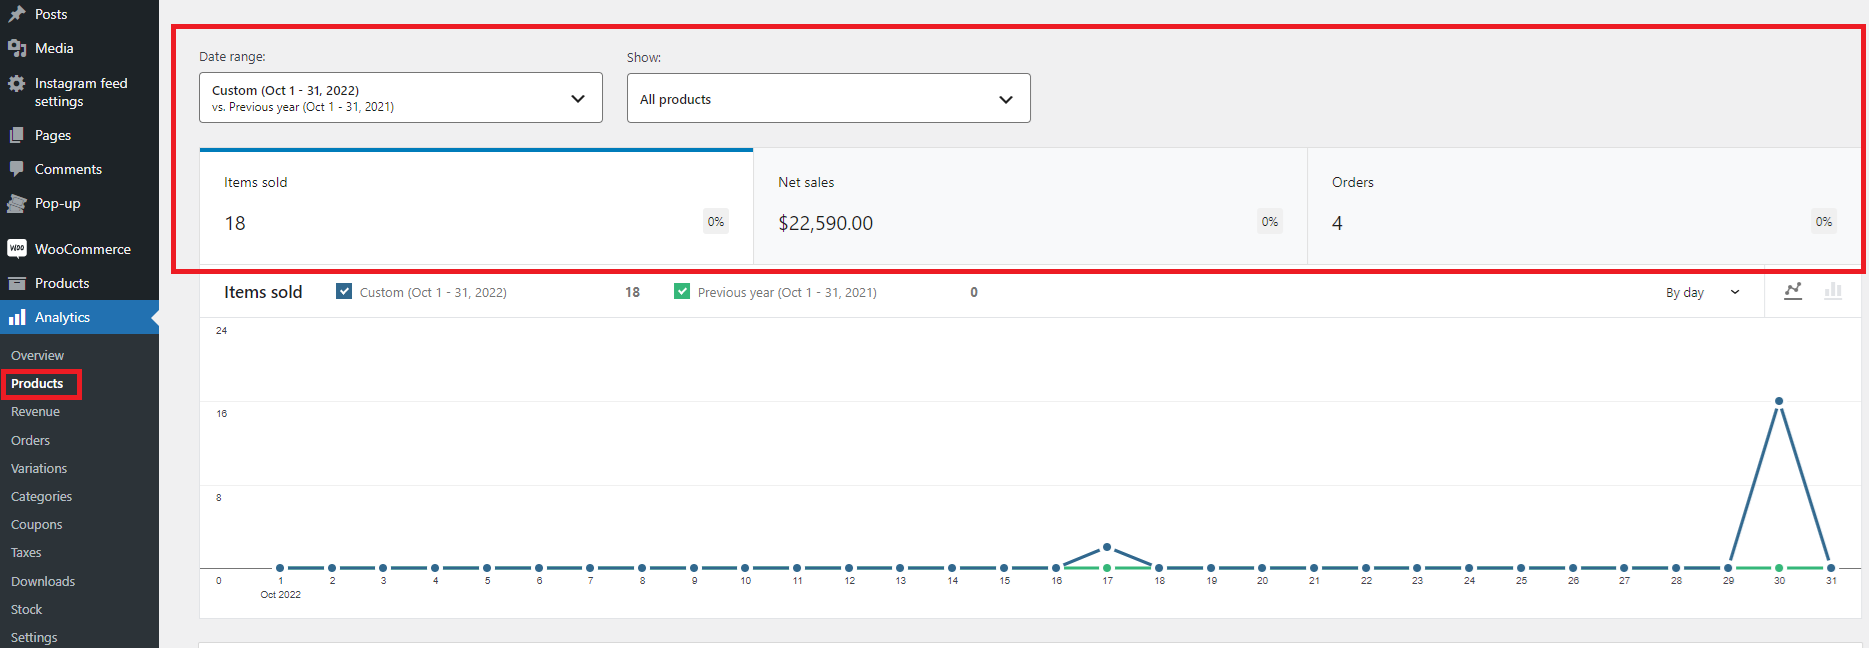
Select Products under Analytics menu to see overall Items Sold, Net Sales & Orders made on your respective regional Globber site.
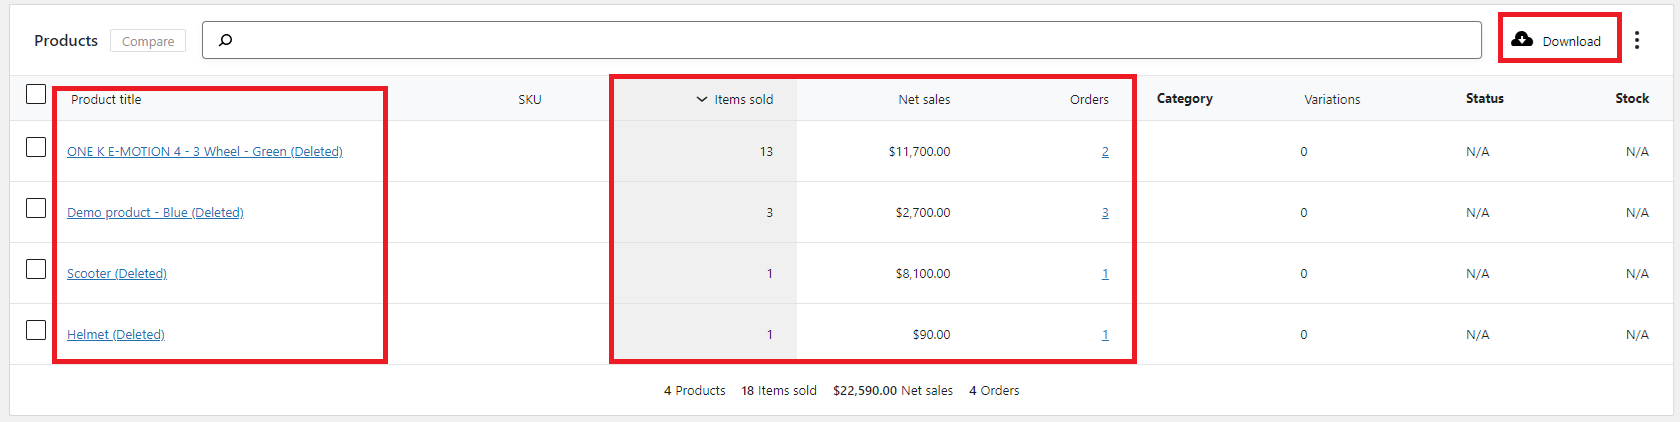
At the bottom, you will see an overview of the most purchased Globber products on your regional Globber site.
You can export these data points as a CSV or Excel file by selecting the Download icon in the top right corner.
Checking Stocks
Another use of the Analytics tab is to view an overview of product stock levels on your regional Globber site.
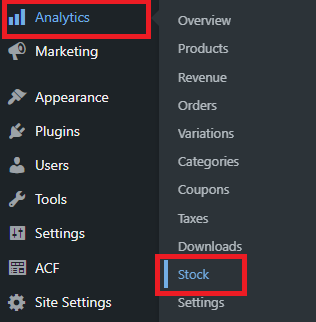
In WordPress dashboard, navigate to the Analytics tab on the left-hand side menu and select Stock
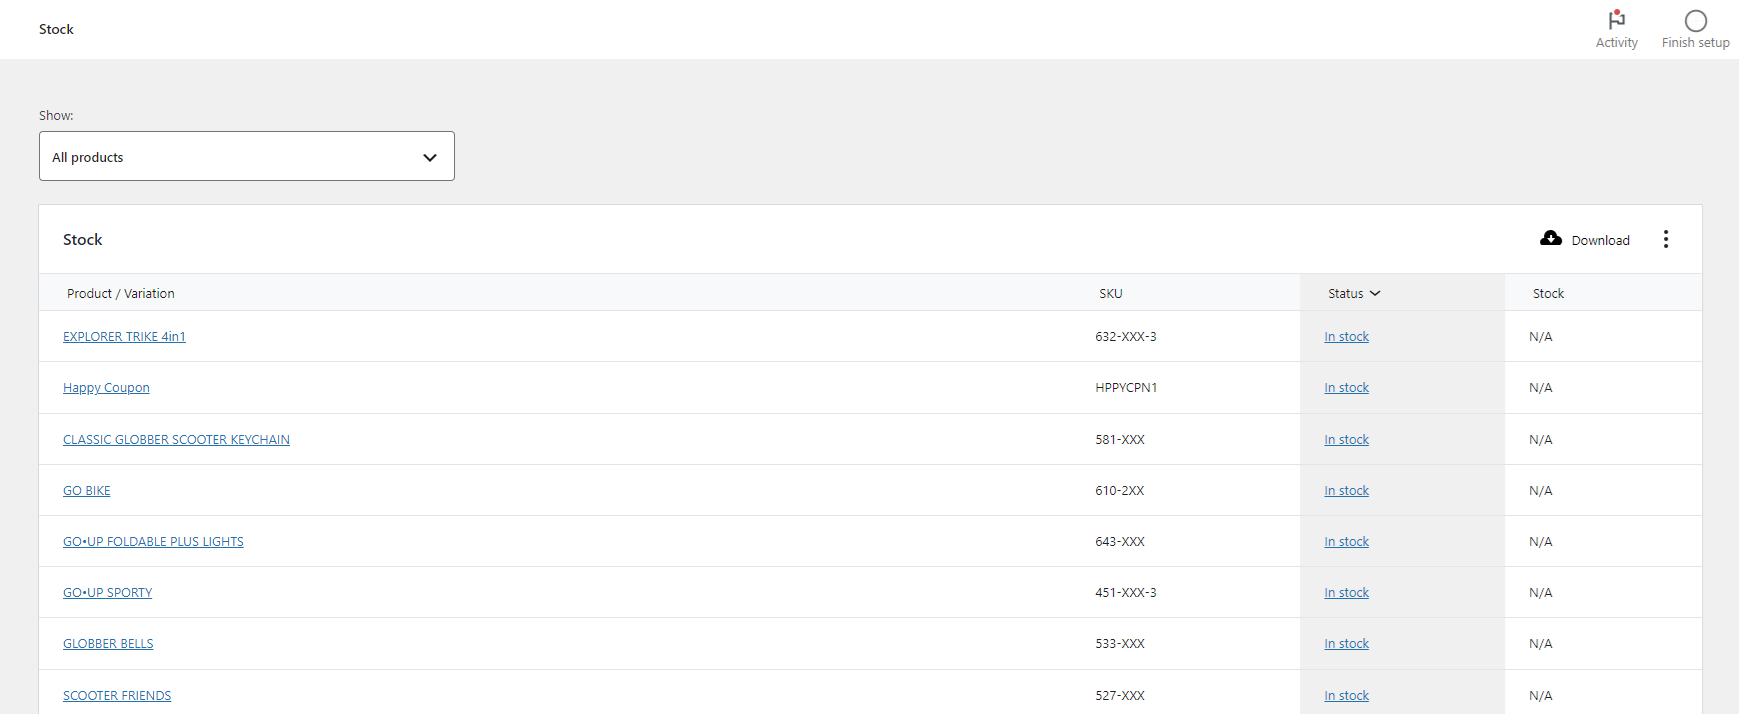
In the Stock page under Analytics section, you can view all product stock statuses and sort your view according to status.
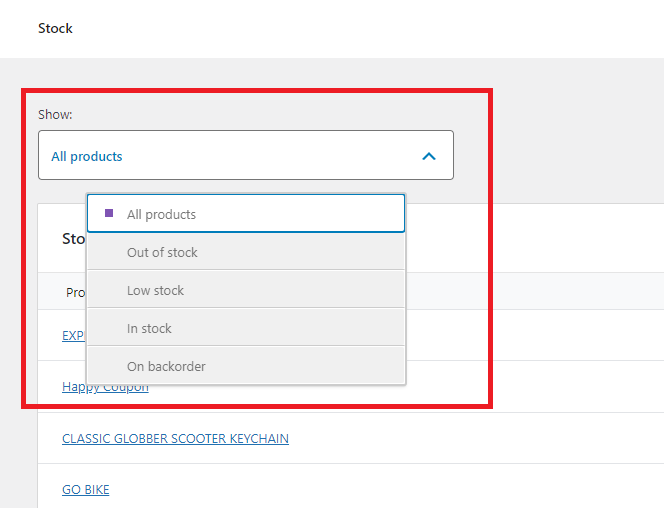
You can also select different options ranging from All products, Out of stock, Low stock, In stock and On backorder
You can export the stock data as a CSV or Excel file by clicking the Download cloud icon in the top right corner of the Stock table.
